Jan 1, 2026
MetaTrader 5 Trading Suite — Risk Management, Portfolio Analytics & Equity Visualization
Three-component MQL5 system covering dynamic risk-based execution, real-time portfolio metrics, and multi-curve equity visualization for active traders
A three-component MQL5 suite built for a private trading client, covering the full workflow from trade execution to performance review — entirely inside MetaTrader 5, with no external tools.
19 performance metrics · 4 grouping modes · 20 simultaneous equity curves · EN / IT
Available as a ready-to-deploy product and open to customization. Custom MQL5 development (execution logic, metrics, dashboards, broker-specific rules) is also available independently of this suite.
Components
Risk-Based Execution EA
An on-chart execution panel that eliminates manual lot-size calculation.
- Bidirectional sizing: enter a risk amount (in currency) to get a lot size, or enter a lot size to see the implied risk
- Draggable stop-loss line synchronized in real time with a numeric input field — drag to adjust, the lot size updates instantly
- One-click Buy / Sell buttons and a collapsible UI panel
- Slippage buffer, tick-size snapping, and broker stops-level enforcement built in
- Full English / Italian localization
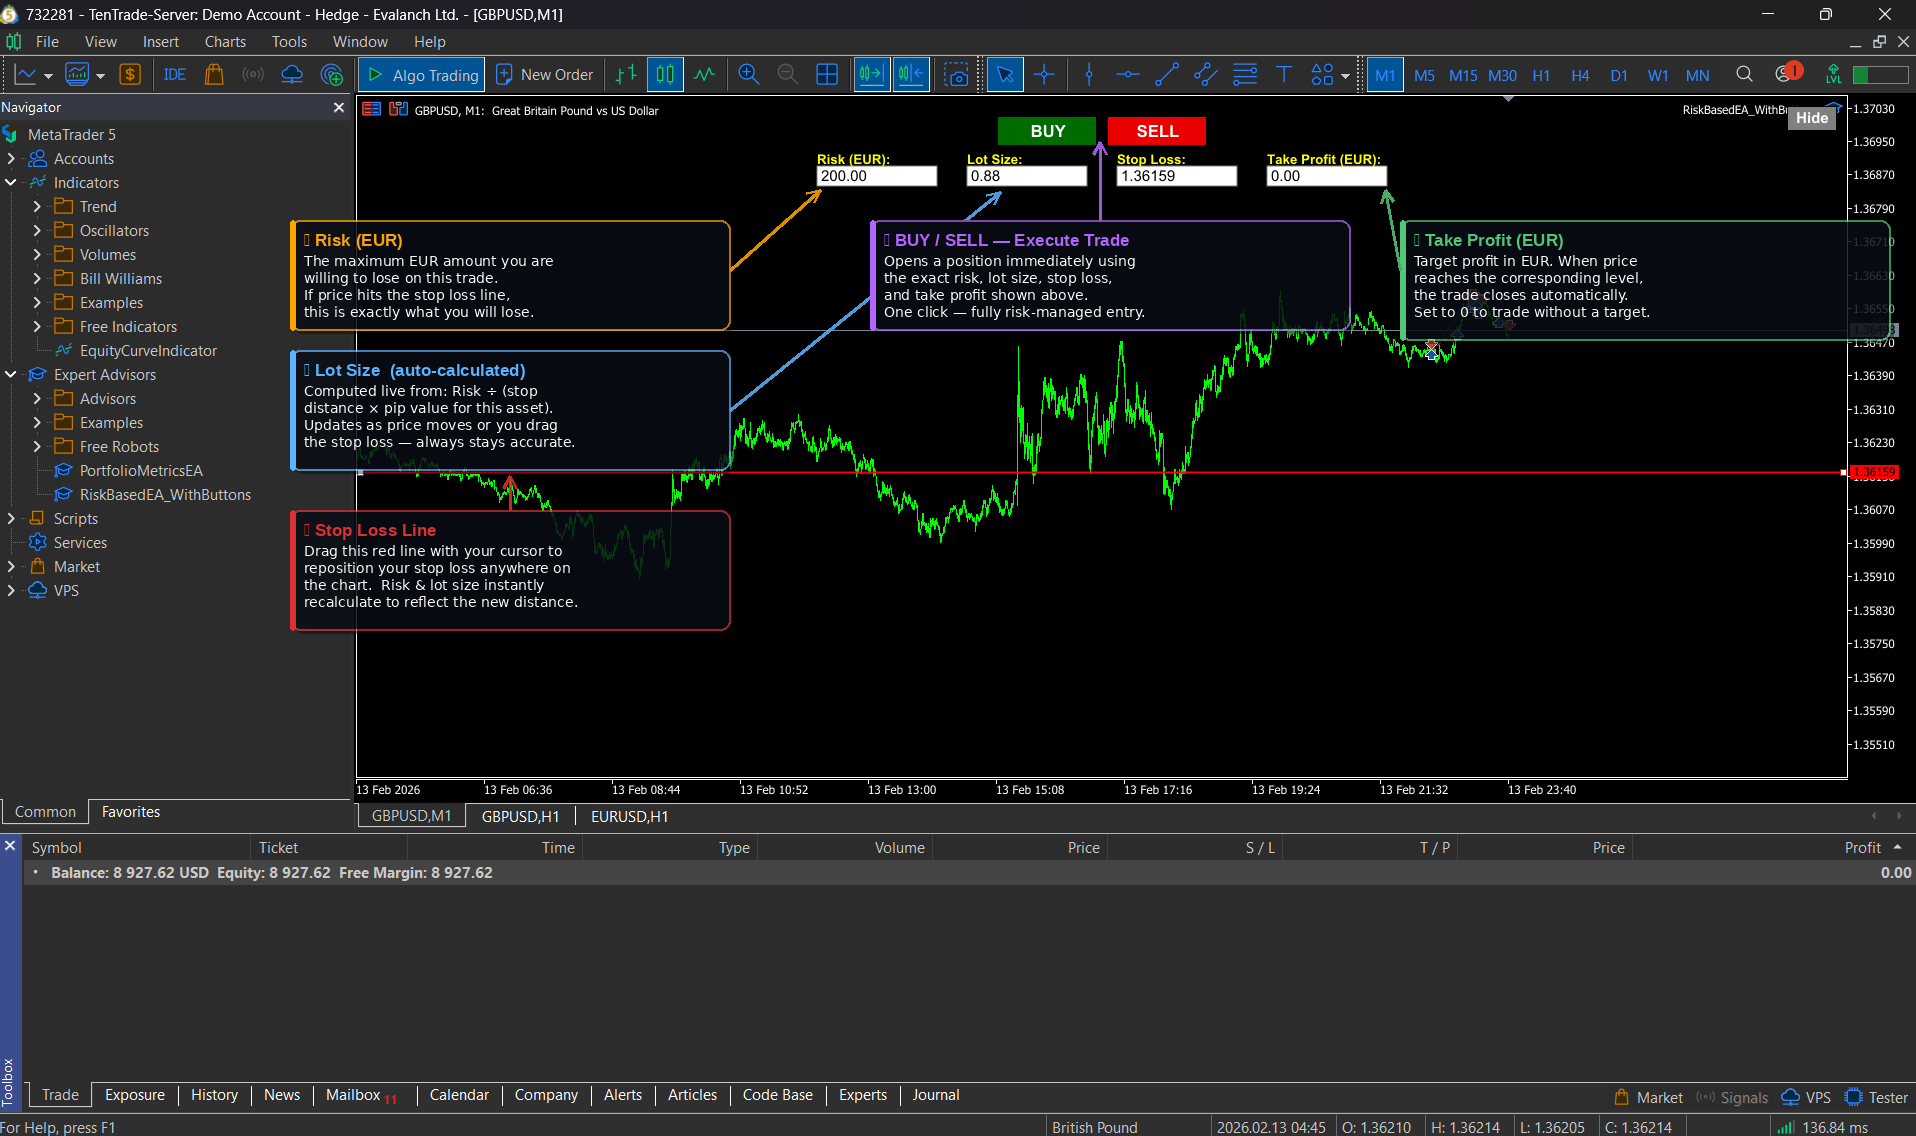 On-chart execution panel with interactive position sizing and stop-loss controls.
Live Demo
Live execution showing realized loss and take-profit matching the EA's risk/reward computations, including the 3% slippage buffer.
Portfolio Analytics Engine
Reads the MT5 deal history and displays a full performance dashboard on the chart. Computes 19 metrics across 4 grouping modes.
Metrics: win rate, profit factor, risk-reward ratio, expectancy, total return, max drawdown (% and monetary), annualized Sharpe ratio, mean return, return standard deviation, gross profit, gross loss, net profit, average win, average loss, starting and final equity.
Grouping modes — all metrics can be broken down by:
- Full portfolio
- Asset / symbol
- Long vs. short
- Day of week
Date range and starting equity are editable directly on the chart without reopening the inputs dialog. Recalculation runs on load and on a configurable daily schedule.
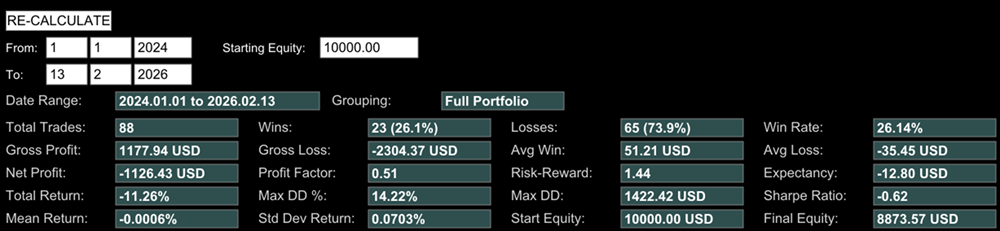 Full-portfolio dashboard with drawdown, Sharpe, and return statistics.
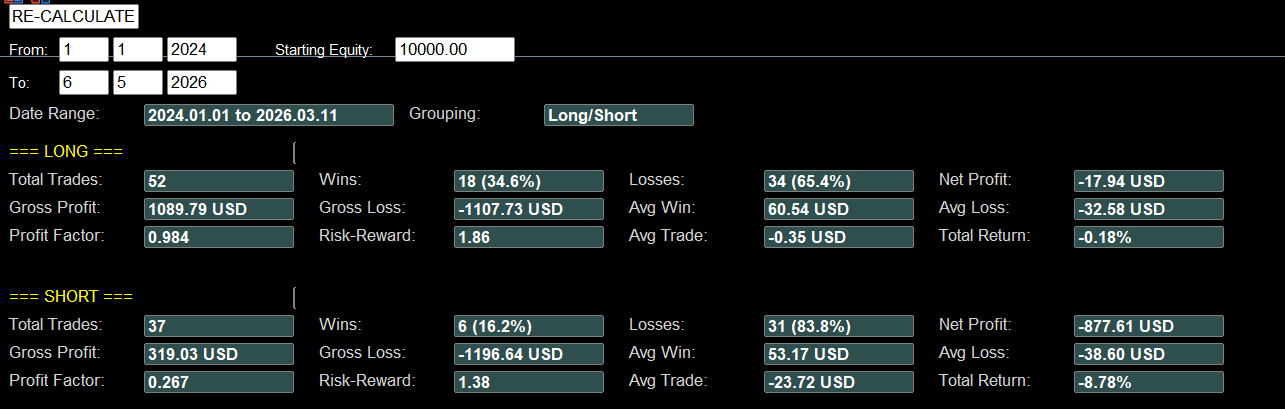 Long vs. short breakdown — separate profitability and efficiency metrics per direction.
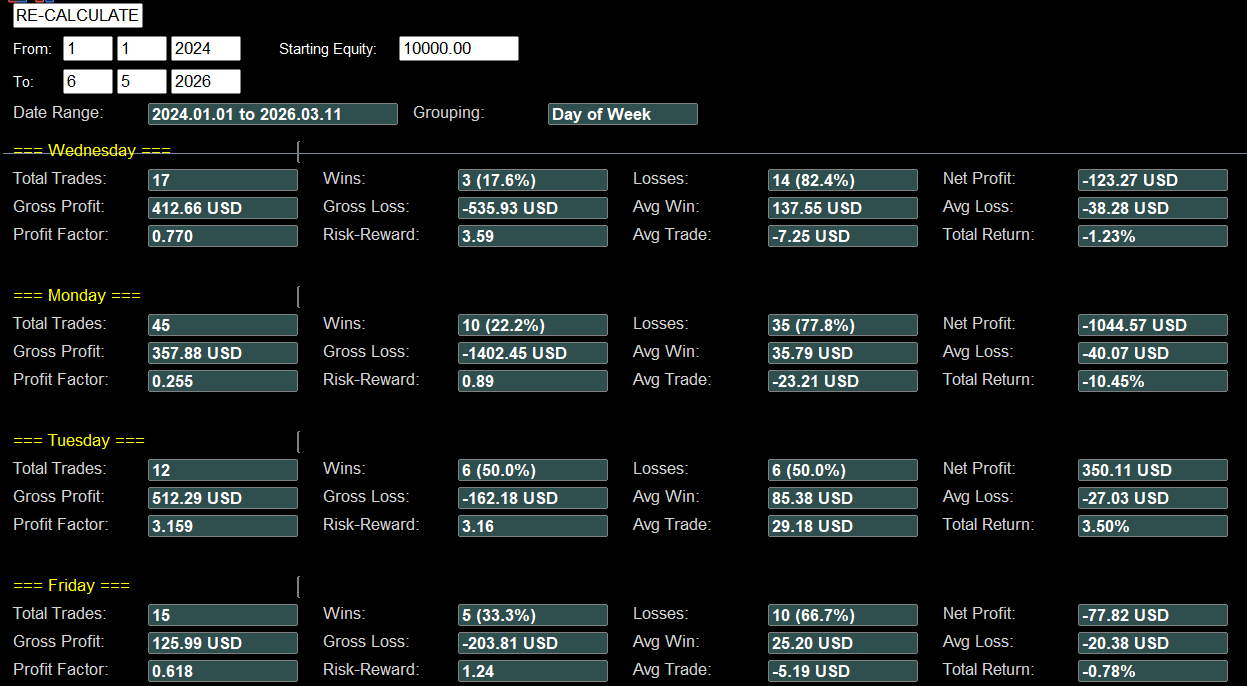 Day-of-week analysis to surface session and time-pattern effects.
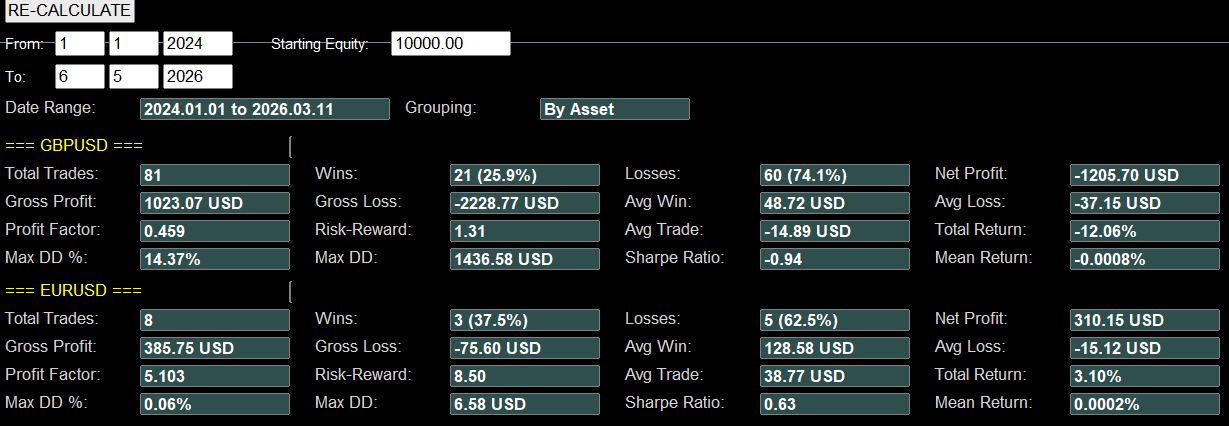 Per-symbol decomposition with individual return, drawdown, and Sharpe.
Multi-Curve Equity Indicator
A subwindow indicator that plots equity curves alongside the price chart — up to 20 curves simultaneously, one per asset, direction, or weekday group.
- Each curve color-coded with an auto-generated legend in the subwindow
- Reads CSV files exported by the analytics EA — self-configuring when grouping mode changes
- Timestamps mapped to bar positions via
iBarShift, so curves stay aligned across any timeframe
Project Contributions
- End-to-end delivery - designed and delivered a complete MT5 workflow from execution to analytics to visualization, not just an isolated EA feature
- Productization mindset - packaged client work into a reusable solution that can be deployed as a product and adapted for different trader profiles
- Risk-first trading design - prioritized practical capital protection and consistent position sizing to reduce avoidable execution mistakes
- Actionable performance insights - built reporting that helps traders understand results by portfolio, asset, direction, and day-of-week to support better decision-making
- User-focused experience - created a chart-native interface that is easy to operate in live markets, including bilingual messaging for broader usability
- Customization-ready architecture - structured the suite to support ongoing enhancements, strategy-specific adaptations, and broker-specific requirements