Nov 4, 2026
Can a Small Language Model Trade from Standard Market Indicators?
A 1.7B model chooses buy, sell, or hold from twelve daily indicators, with no strategy written in, and is scored against textbook rules and matched-random chance.
A lot of language models can talk about moving averages, RSI, and other everyday market readings. I wanted to see what happens when a small one has to use those readings to trade.
I gave Qwen3 1.7B twelve daily features from a single market and asked it to choose buy, sell, or hold. It could be fully invested or in cash. I did not give it a strategy and gave it freedom to analyse and make its own reasoning. The markets were SPY, QQQ, TLT, and GLD. I do not share the market or the date to avoid leakage.
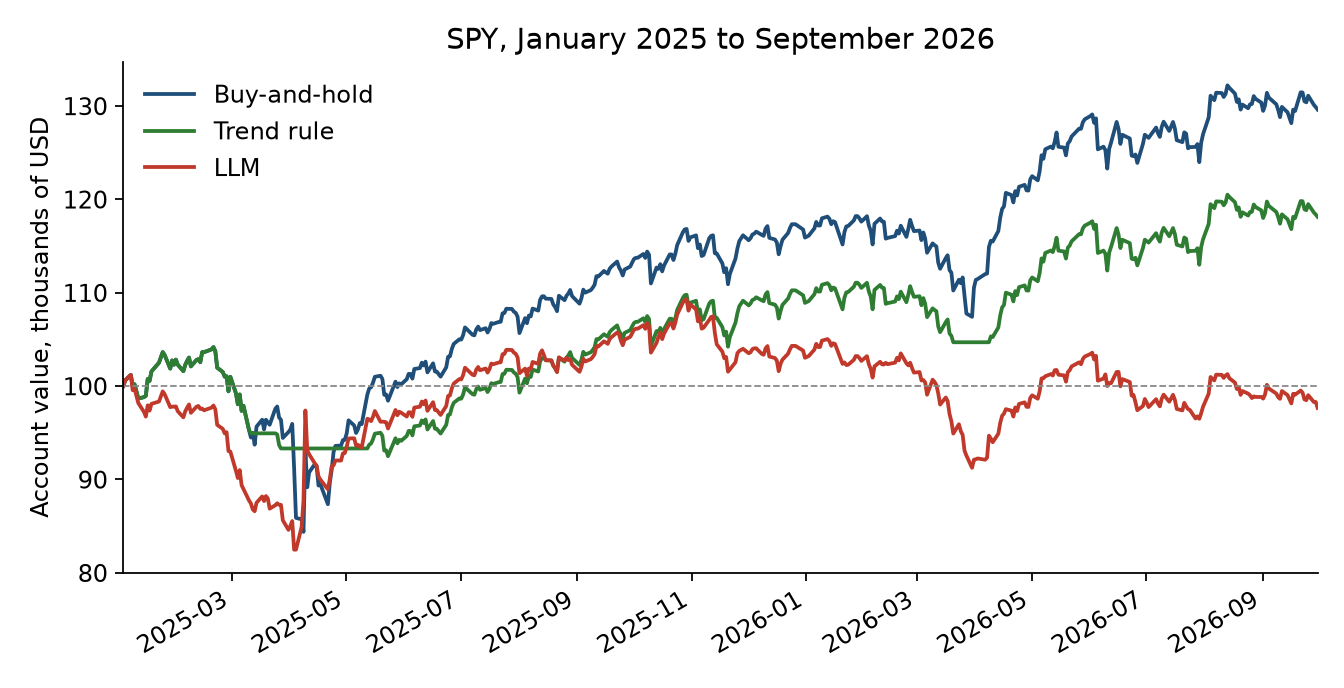
To pass, it had to beat two simple textbook rules, and also finish above the 90th percentile of random strategies that traded about as often as it did, on at least three of the four markets. It missed that bar on all four. Over the same window, same fills, and same costs, buy-and-hold was about +29.6% on SPY, +43.9% on QQQ, −11.5% on TLT, and +55.5% on GLD. The model was invested 69% to 80% of the time and finished down on every market. It also often asked for trades that could not change its current position.
1. Goal and limits
I asked a simple question. If I put a small language model in a trading seat, show it standard daily features, and leave it to decide what those features mean, can it find a way of trading that works better than simple rules and chance?
Each day the model saw recent returns, how far price sat from its 50-day and 200-day averages, how far it sat from the 52-week high, RSI, volatility, relative volume, the opening gap, the day's range, where the close sat in that range, and whether it was already invested. It did not see the symbol, the date, the raw price, news, earlier prompts, or how its past trades had gone.
The test used one 1.7-billion-parameter model, four exchange-traded funds, daily bars, and a choice between being fully long or fully in cash. There were no shorts, no position sizing, no stocks, and no extra information from outside the price series. SPY and QQQ are two listings of a similar equity bet, counted here as two markets. Prices are unadjusted, and dividends are left out. The ranking across strategies is still fair, because every long strategy is affected in proportion to its time in the market. The level of the returns is light by roughly the dividend yield. For TLT that is on the order of 4% a year.
2. Method
The code, prompts, and run setup are in LLM-STRATEGY-RESEARCH. That repository calls this experiment objective 1.
Qwen3 1.7B ran locally through Ollama, with temperature set to zero and its optional thinking mode switched off. After each close it wrote a short analysis and chose BUY, SELL, or HOLD. The order filled at the next open. Each run started with $100,000. Each side of a trade pays 0.10% plus 0.05% slippage, so a round trip costs about 0.30% of the account when the position is fully invested.
I worked on the prompt using data from January 2023 through December 2024. Then I ran the chosen version once on January 2025 through September 2026. Qwen3 1.7B came out at the end of April 2025, so January through April 2025 can overlap its training period. A loss is not what memorization of a winning tape would produce, but that overlap belongs on the page.
The model was compared with three textbook strategies on the same markets, fills, and costs. Buy-and-hold buys on the first session and stays invested. I report it as a picture of the market itself. The trend rule stays invested while the close is above its 200-day average: it buys when that gap turns positive, and it sells when the gap turns negative. The RSI rule uses a 14-day RSI. While in cash, it buys if RSI is below 30. While invested, it sells if RSI is above 70. The pass bar uses the trend rule and the RSI rule. Buy-and-hold is only context.
A random strategy has to trade on a similar rhythm, or a quiet strategy and a busy one are not really comparable. After each model run I counted three things: how many times it entered the market (n), how many sessions it spent invested (d_in), and how many sessions it spent in cash (d_out). The random strategy then buys with probability n / d_out while it is in cash, and sells with probability n / d_in while it is invested. I ran that 200 times per market, each with a different seed. Those runs enter about as often as the model and stay invested for about as long. Their Sharpe ratios form the chance distribution and we expect the model to beat the 90th percentile of this chance distribution. I also record where the model's own Sharpe sat in the same list.
The model had to beat both that 90th-percentile bar and the better of the two textbook rules, on at least three markets.
I changed the prompt only when a behavior check failed, never to chase higher returns. The first change explained the units and which orders were legal in each state. On validation, the rate of illegal actions fell from 53.0% to 29.9%, which was still above the 10% limit. A later version added examples of wrong actions and yet the rate rose from 29.9% to 38.9%, so that version was not the one I tested. The tested prompt explains what each feature means and which actions are legal in each state. It still leaves the model to decide how to use the features. Here is that prompt:
You are a disciplined trader managing one long-or-flat position in a single market. You are not told which market it is or the date. Each day after the close you receive the readings below, computed from daily prices up to today. Your order is filled at the next session's open, and every trade has a small cost.

Trend and momentum. On a return, a plus is a gain over that window and a minus is a loss. On a moving-average gap, a plus means the close is above that average and a minus means it is below.
- return over the last session: {r1:+.2%}
- return over the last 5 sessions: {r5:+.2%}
- return over the last 20 sessions: {r20:+.2%}
- price vs its 50-day moving average: {ma50_gap:+.2%}
- price vs its 200-day moving average: {ma200_gap:+.2%}
- distance from the 52-week high: {high52_gap:+.2%}. 0% means the close is at that high. A negative number is how far below it. This reading is never above zero.

Overbought or oversold:
- RSI over 14 days: {rsi14:.1f}. The scale runs from 0 to 100.

Risk and activity:
- volatility over the last 20 sessions, annualized: {vol20:.2%}. This percent is the annualized size of recent daily moves.
- today's volume vs its 20-day average: {volume_ratio:.2f}x. 1.00x equals that average. Below 1 is lighter than the average. Above 1 is heavier.

Today's session:
- opening gap vs the previous close: {open_gap:+.2%}. A plus means the open was above the previous close. A minus means it was below.
- range from high to low, as a percent of the close: {day_range:.2%}
- where the close sits in today's range (0 = at the low, 1 = at the high): {close_location:.2f}

Current position: {position}. in means you already hold this market. out means you hold only cash.

Decide what to do for the next session. Weigh the trend, the risk of a reversal, and the cost of trading.

If the position is in, the only orders are SELL or HOLD. SELL exits to cash. HOLD stays long. A bullish view while you already hold is HOLD, not BUY.
If the position is out, the only orders are BUY or HOLD. BUY enters from cash. HOLD stays in cash. A bearish view while you hold only cash is HOLD, not SELL.

Reply with only this JSON object: {"analysis": "...", "decision": "BUY"|"SELL"|"HOLD"}
3. Results
The model missed both halves of the bar on all four markets.
| Market | Buy-and-hold | LLM return | LLM Sharpe | Chance pct. | Random 90th | Best rule Sharpe | LLM DD | B&H DD | Passed |
|---|---|---|---|---|---|---|---|---|---|
| SPY | +29.61% | −2.35% | −0.02 | 50 | 0.48 | 1.08 | 18.5% | 19.0% | No |
| QQQ | +43.89% | −5.30% | −0.12 | 34 | 0.61 | 1.29 | 26.8% | 22.9% | No |
| TLT | −11.46% | −40.84% | −3.71 | 27 | −2.63 | 0.08 | 43.6% | 16.2% | No |
| GLD | +55.49% | −7.27% | −0.10 | 28.5 | 0.75 | 1.57 | 36.7% | 26.4% | No |
The markets themselves were not a falling tape, except TLT. The model was invested 69% to 80% of the days and still finished below cash on all four. On SPY it sat at the 50th percentile of its matched-random runs, so that result was a typical random path with the same trading rhythm. QQQ, TLT, and GLD sat at the 34th, 27th, and 28.5th percentiles, which is worse than most of those runs. None of the four reached the 90th percentile.
On SPY the model agreed with the trend rule on 77% of days. That rule made about +18% in four trades. The model's SPY drawdown was 18.5%, almost the same as buy-and-hold at 19.0%, with a much worse return. On TLT the model's drawdown was 43.6%, against 16.2% for buy-and-hold.
| Market | Invested | Trades | Avg. hold | Pointless actions | Trend agreement | RSI agreement |
|---|---|---|---|---|---|---|
| SPY | 80.1% | 80 | 4.38 | 31.7% | 76.8% | 29.1% |
| QQQ | 76.0% | 97 | 3.42 | 28.9% | 74.3% | 26.1% |
| TLT | 69.3% | 126 | 2.40 | 19.3% | 43.1% | 58.7% |
| GLD | 73.9% | 105 | 3.08 | 29.8% | 68.3% | 31.9% |
The model completed 80 to 126 round trips. At about 0.30% of the account per round trip, that cost pile is large enough to turn an ordinary long bias into a loss. These features showed no edge after costs. A quieter long bias would have kept more of the market move.
On the test, 478 of 1,744 decisions (27.4%) could not change the current position. Most of those were BUY while the model was already invested, close to the 29.9% seen on validation with the same prompt.
I also compared the model's daily position with the two textbook rules. On SPY, QQQ, and GLD, it lined up with the trend rule on about 68% to 77% of days. On TLT that share dropped to 43%, and the RSI rule was the closer match. Those overlapping positions still led to different results. The model traded much more often, and it did worse than the matching rule on every market.
I then fitted a small decision tree, with max depth equal to 2, to see whether a couple of features could copy the model's daily position. The tree got 82.1% of SPY days right, 77.8% of QQQ, 69.5% of TLT, and 78.0% of GLD. The first split changed from market to market: distance from the 52-week high on SPY and QQQ, 20-day return on TLT, and RSI on GLD. On some markets the tree said "invested" on almost every branch, so part of that accuracy just comes from the model spending most of its time in the market.
Every reply parsed. In a sample of the written analyses, the text usually pointed the same way as the chosen action. The remaining issue was the sequence of trades: too many switches, and too many orders that ignored the position already held.
4. Interpretation
This test does not show an edge from these features. The model lagged the simple rules. On SPY its Sharpe was a typical matched-random outcome. On the other three markets it was worse than most of those random runs. The short holding periods also look like a reaction to day-to-day moves, even though some of the features cover 50 to 252 sessions. The turnover was high enough that costs can explain a large part of the gap versus staying invested.
The written analyses were usually readable, and they usually matched the chosen action. The model still kept asking to buy when it was already long. After I explained the legal actions, that habit became less common, but it stayed well above the 10% limit I had set. I only allowed a few of those fixes, so I stopped there.
This is one small model, one prompt family, and four markets, with SPY and QQQ counting a similar equity bet twice. Twelve features may be a lot for a model of this size to hold in mind at once. A smaller set of features, a stronger model, or a prompt that walks through how to look at the numbers could all change the picture. So could giving the model a short memory of what it just did.
5. Conclusion and next steps
Qwen3 1.7B did not find a reliable way to trade from these indicators. It missed the bar on all four markets, lost money on all four while three of those markets rose, traded too often, and kept sending orders that did not fit its current position.
A few smaller follow-ups are easy to try. I could cut the feature list and see whether the model handles a shorter input more cleanly. I could keep the same setup and swap in a stronger model. I could also add more guidance about how to look at trend, momentum, reversal risk, and mixed signals, while still leaving the final rule unwritten.
The bigger next step is memory and feedback. That would give the model recent readings, its own last decisions, the returns that followed, and the results of open and closed trades, using only information known at decision time. The idea is to see whether a little continuity helps it stay consistent and make use of what just happened. Each of these changes is worth testing on its own, so I can tell which one actually helped.